A Fused Probe-Scoring Kernel: Triton vs CUDA vs cuBLAS
ProbeX reads residual-stream activations inline on a vLLM server and scores them with a frozen linear probe. The tap costs roughly nothing once it lives inside the CUDA graph. But the way it feeds the probe is two ops: gather the last-token rows into a staging buffer, then run a separate matvec over that buffer. The gathered [R, H] slab makes a full round trip to HBM between the two. The obvious question: if you fuse the gather and the score into one kernel, does anything get faster?
I built the fused kernel twice, once in Triton and once in hand-written CUDA (a cpp_extension kernel that stages each residual row in shared memory and block-reduces the dot per probe), both behind the same fp32 reference as the torch index_select + addmm baseline. Twenty tests gate correctness across batch and probe counts (fifteen on-device, five CPU), and both kernels capture into CUDA graphs, which is the property that matters for serving. Every number below comes from committed JSON in results/kernel/ in the probex repo, measured on an A100-80GB and replicated on a second A100 with a different form factor.
At decode sizes, everything ties
At decode sizes the op is too small to be bandwidth-bound. A single request moves about 16 KB and completes in ~13 µs on every backend: torch 13.4, Triton 16.2, CUDA 13.2 (graph-replay p50, R=1). At R=64 the spread stays within a few microseconds. The kernel’s arithmetic intensity is about one flop per byte, two orders of magnitude below the A100’s compute-memory ridge, so the floor is launch overhead, not data movement. I predicted a tie before writing either kernel, and the tie showed up. If someone tells you they made a per-token probe score much faster with a custom kernel at batch 1, ask what they were measuring.
One subtlety in the measurement. For the single-kernel CUDA backend at R=1, eager mode (8.9 µs) beats graph replay (13.2 µs), because capturing one tiny op in its own graph pays a launch cost that only amortizes when many kernels share the graph. In real serving the tap is one node in the model’s graph, so its marginal cost is the kernel’s device time. The standalone-graph numbers are the conservative comparison, not the deployment cost.
Fusion pays off at large batches
At R=8192 the torch path becomes the bottleneck: it writes the gathered slab to HBM and reads it back for the matmul, roughly tripling the residual traffic. The fused kernels read each row once:
| backend | graph p50 | effective bandwidth |
|---|---|---|
| torch (moves 3x the bytes) | 471 µs | 427 GB/s |
| Triton | 101 µs | 664 GB/s |
| CUDA | 144 µs | 466 GB/s |
Triton comes in 4.7x faster than the two-op baseline. Nothing here saturates the A100’s 1935 GB/s either; the best case reaches 34% of the spec-sheet peak, since a per-row reduction kernel is not a bandwidth-tuned copy loop.
Many probes: hand-rolled kernels lose to cuBLAS
The batched multi-probe path ([R,H] · [H,P] → [R,P]) was where custom kernels might have pulled ahead. They did not. Sweeping P at R=64, torch.addmm dispatches a tensor-core cuBLAS GEMM that stays essentially flat from P=1 (17 µs) to P=1024 (21.8 µs). My Triton kernel degrades gracefully to 132 µs. My CUDA kernel, which loops probes serially per block, degrades to 3613 µs.
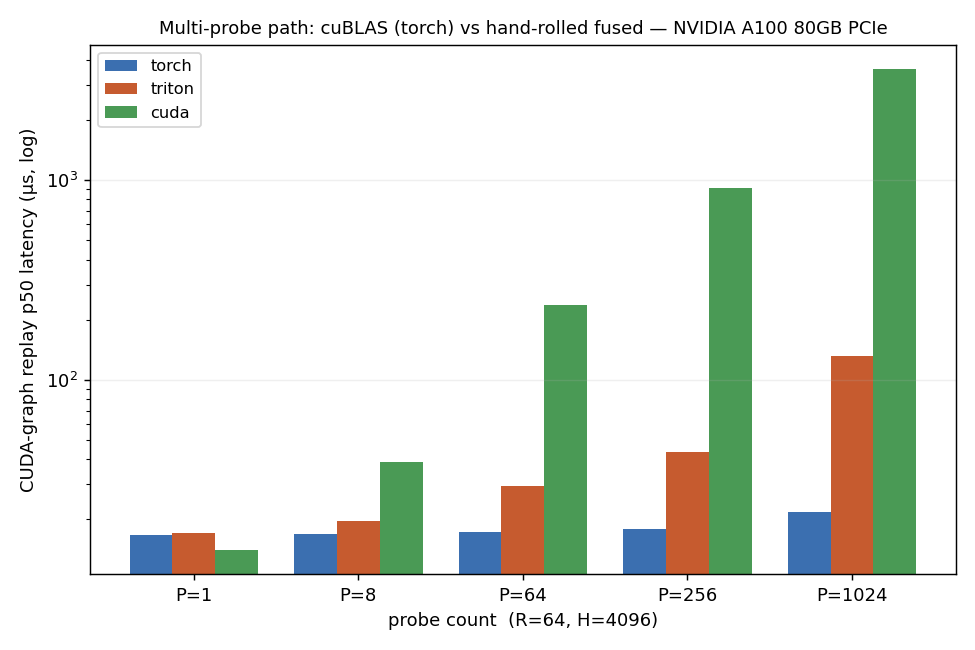
The rule: fuse the gather, and hand the matmul to the library. Beating cuBLAS on a GEMM means targeting tensor cores directly, a CUTLASS follow-up I have not built yet. I will update this post when I build it.
Rooflines without Nsight
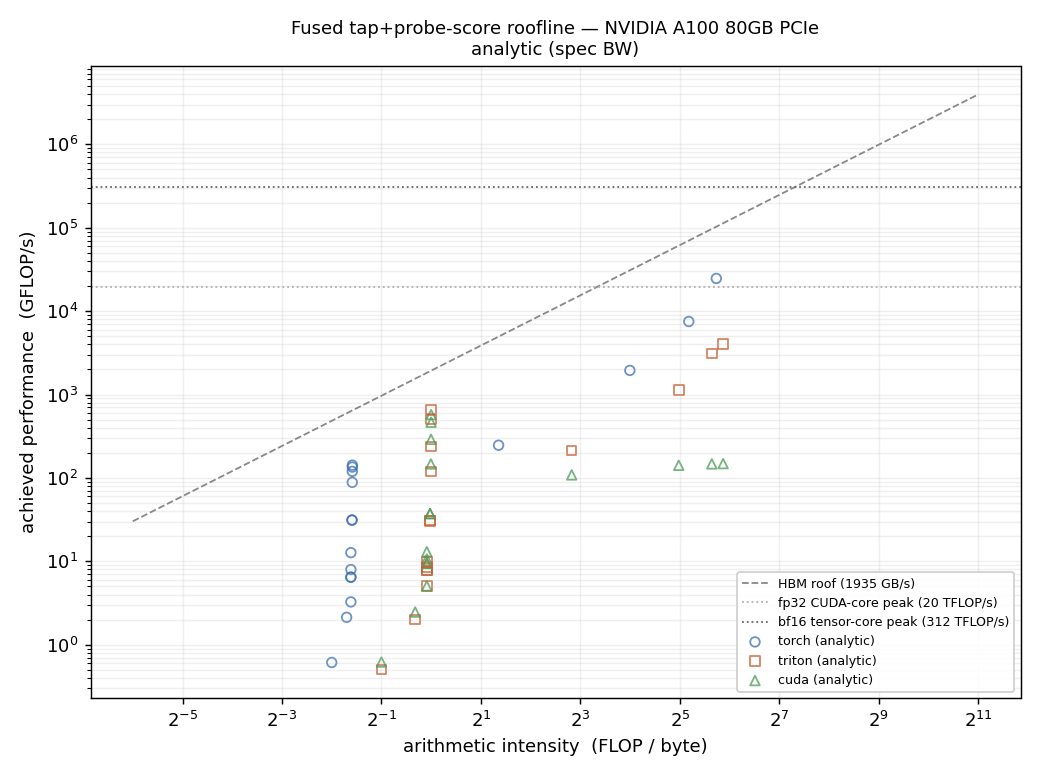
I wanted measured rooflines and could not get them. ncu cannot read performance counters on Modal (unknown device error) or on either VAST host I rented (ERR_NVGPUCTRPERM: the driver restricts profiling to admin and the containers are unprivileged). This appears to be the standard condition of shared GPU clouds, and the failed attempts are committed as evidence. The rooflines in the repo are therefore analytic, device-spec bandwidth as the roof with measured graph-replay timings as the points.
What I shipped
The fused path is merged into the ProbeX tap as an optional mode (PROBEX_FUSED_SCORE=1), staging [R, P] scores instead of the [R, H] slab. The default path is unchanged. For the single-probe production case the backends tie, so the deciding factor is portability: the Triton kernel runs on ROCm with no source change, the CUDA one is NVIDIA-only. That makes Triton the implementation I would deploy even at parity.
Reproduction: results/kernel/ in probex holds the benchmark JSONs, the figures, and FINDINGS.md; deploy/fused_kernel.py reruns the tests and sweeps on Modal.